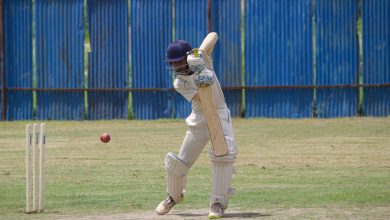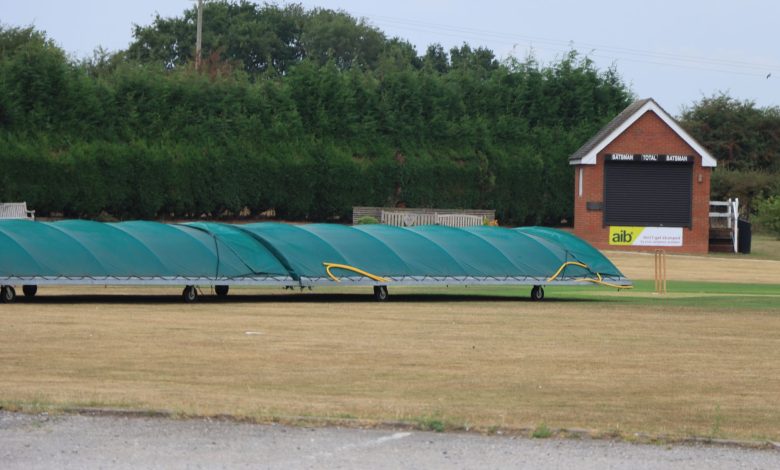
Rain takes the players off. Say the chasing side is 148 for 3 after 32 overs, needing 280. Twenty minutes later the covers come off, the match is cut to 42 overs, and the scoreboard shows a revised target nowhere near the number in your head. The commentator says “DLS” and moves on. The DLS method is doing something specific, and once you see what it counts, that number stops looking arbitrary.
DLS stands for Duckworth–Lewis–Stern. The English statisticians Frank Duckworth and Tony Lewis devised it, it was first used in an international on 1 January 1997, and the ICC adopted it as its standard in 1999. After both men retired, the Australian statistician Steven Stern took over and the method was renamed in November 2014.
Resources, not overs
Everything in the DLS method rests on one idea: a batting side does not start with overs, it starts with resources. Two of them. As ESPNcricinfo puts it, a team begins a 50-over innings with “300 balls, and ten wickets.” Those two things together are expressed as a single percentage. An untouched innings is 100% of resources. Every ball bowled spends a little of it, and every wicket lost spends a lot.
When weather shortens a match, one side ends up with a smaller share of resources than the other. The DLS method compares the two percentages and rewrites the target so the chase demands the same proportion of runs, not the same run rate.
That distinction is the point. Suppose a side has made 280 in 50 overs and rain cuts the chase to 25. A run-rate calculation would set 141 to win. But the chasing team now has all ten wickets for 25 overs, so they can swing from the first ball with nothing to protect. The official DLS methodology document says resources “are not in direct proportion to the number of overs available to be faced, as with the average run rate method.” Halving the overs does not halve the difficulty.
Why wickets in hand change the answer
The second resource is the one most arguments miss. Two teams can be 40 overs into an innings with identical scores and have completely different prospects. A side three down is likely to score more in the last ten than a side eight down, because the batters left can attack. The DLS tables account for that, which is why the revised target after a rain break depends on how many wickets the chasing team had lost when the players walked off.
One quirk is worth knowing. Only the wickets lost at the moment of the interruption feed into the recalculation. Wickets that fall afterwards do not push the target back up. If you lose three in the over after play resumes, you are in trouble, but the number you are chasing does not move.
Lost overs do not all cost the same either. Overs taken out late hurt more than overs taken out early, because late overs are more productive. Ten removed at the 40-over mark is a heavier blow than ten removed at the start.
Par score and target are not the same thing
These two get used interchangeably on commentary and they mean different things. The par score is what the chasing team should have reached by a given point, given the overs used and wickets lost. The target is the fixed, revised number to win after an interruption.
Par moves: it shifts every ball and jumps every time a wicket falls. The target, once set, sits still. The difference matters most when a match is abandoned mid-chase and never restarts, because the result then comes down to whether the batting side was ahead of or behind par when the rain arrived. Teams have won matches they never finished, by two runs.
The arithmetic behind the DLS method
The formula itself is short. Call the first innings score S, the resources available to the side batting first R1, and the resources available to the side batting second R2, both as percentages.
When the chasing side has fewer resources, the target is S × R2/R1, plus one, rounded down. When both sides have the same resources, it is simply S + 1, the ordinary target. When the chasing side somehow has more resources than the team that batted first — which happens when the first innings is cut short and the second is not — the method adds the difference multiplied by a constant called G50.
G50 is the average score expected in a full 50-over innings: the methodology document sets it at 245 for matches between full member nations, and 200 for associate teams and women’s ODIs. It exists because you cannot scale a target upward with a ratio; you need a baseline for what the extra resources are worth.
When the DLS method cannot give you a result
There is a floor. Under the ICC Men’s Standard ODI Playing Conditions, clause 16.1.2, “a result can be achieved only if both teams have had the opportunity of batting for at least 20 overs, unless one team has been all out in less than 20 overs or unless the team batting second scores enough runs to win in less than 20 overs.” Below that the match is a no result, whatever the scoreboard says. In T20 internationals the equivalent floor is five overs a side.
This is why a washout in a tight group stage is costly. A no result splits the points, which often throws qualification onto run rate instead. If you follow group tables closely, it is worth reading our explainer on how net run rate decides who qualifies, because the two calculations frequently decide the same tournament between them.
Why it still feels unfair sometimes
The DLS method is built on historical scoring patterns, averaged across thousands of innings. It describes what teams usually do from a given position, so a side playing nothing like the average — a freak collapse, an extraordinary partnership — can end up with a target that does not match the game you just watched. The 2014 revision under Stern updated the model for modern scoring rates and the faster arc of T20 innings, but the criticism has not gone away, particularly around very short chases, and reasonable people still disagree about how well it handles the extremes.
The alternative is less disputed. Setting targets by run rate alone rewards the side that gets the shortened chase, every time. The DLS method at least tries to price both of the things a batting team actually spends.
Photo by Jan Wright on Pexels